Our Business
07Financial and operational highlights
Explore the Fund's financial and operational highlights for FY2025/26.

Asset growth
UGX 32.87Tn
26.4%
16.1%Five-year CAGR
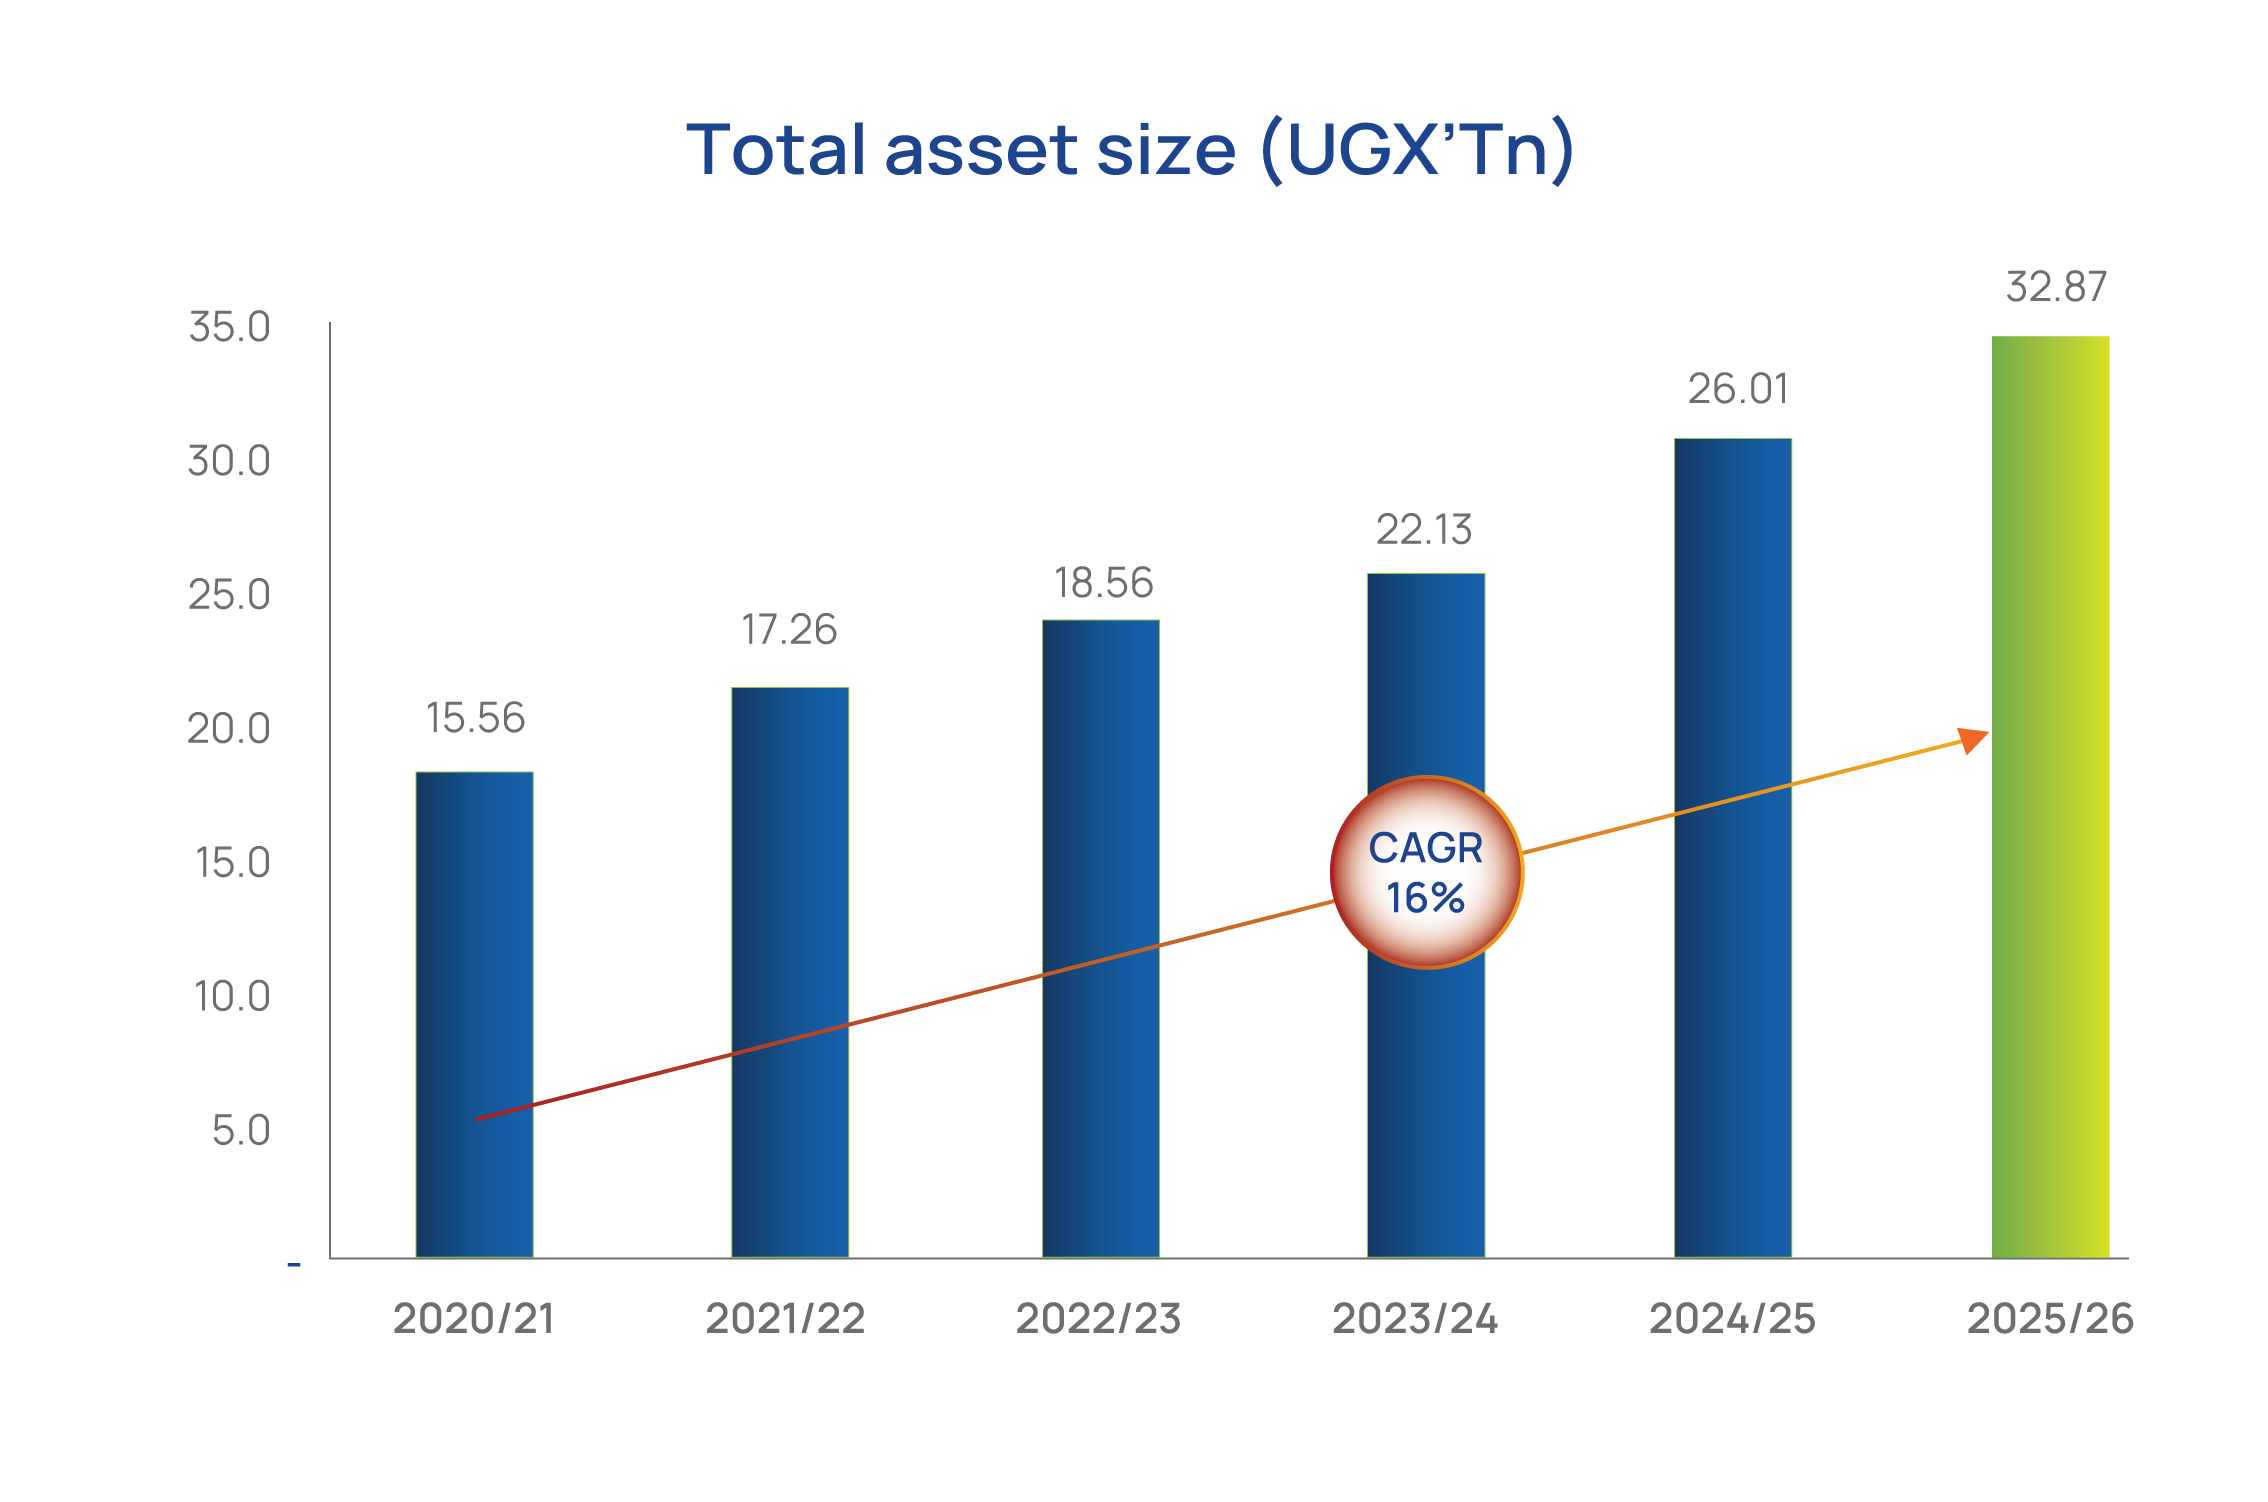
- The Fund balance sheet size increased to UGX 32.87Tn (FY2024/25: UGX 26.01Tn; +26.4%), a five-year CAGR of +16.1%.
- This growth is consistent with the combined growth in investments, driven by contributions and income generated, including unrealised gains, net of benefits paid out.
Total income
UGX 6.51Tn
85.1%
28.8%Five-year CAGR
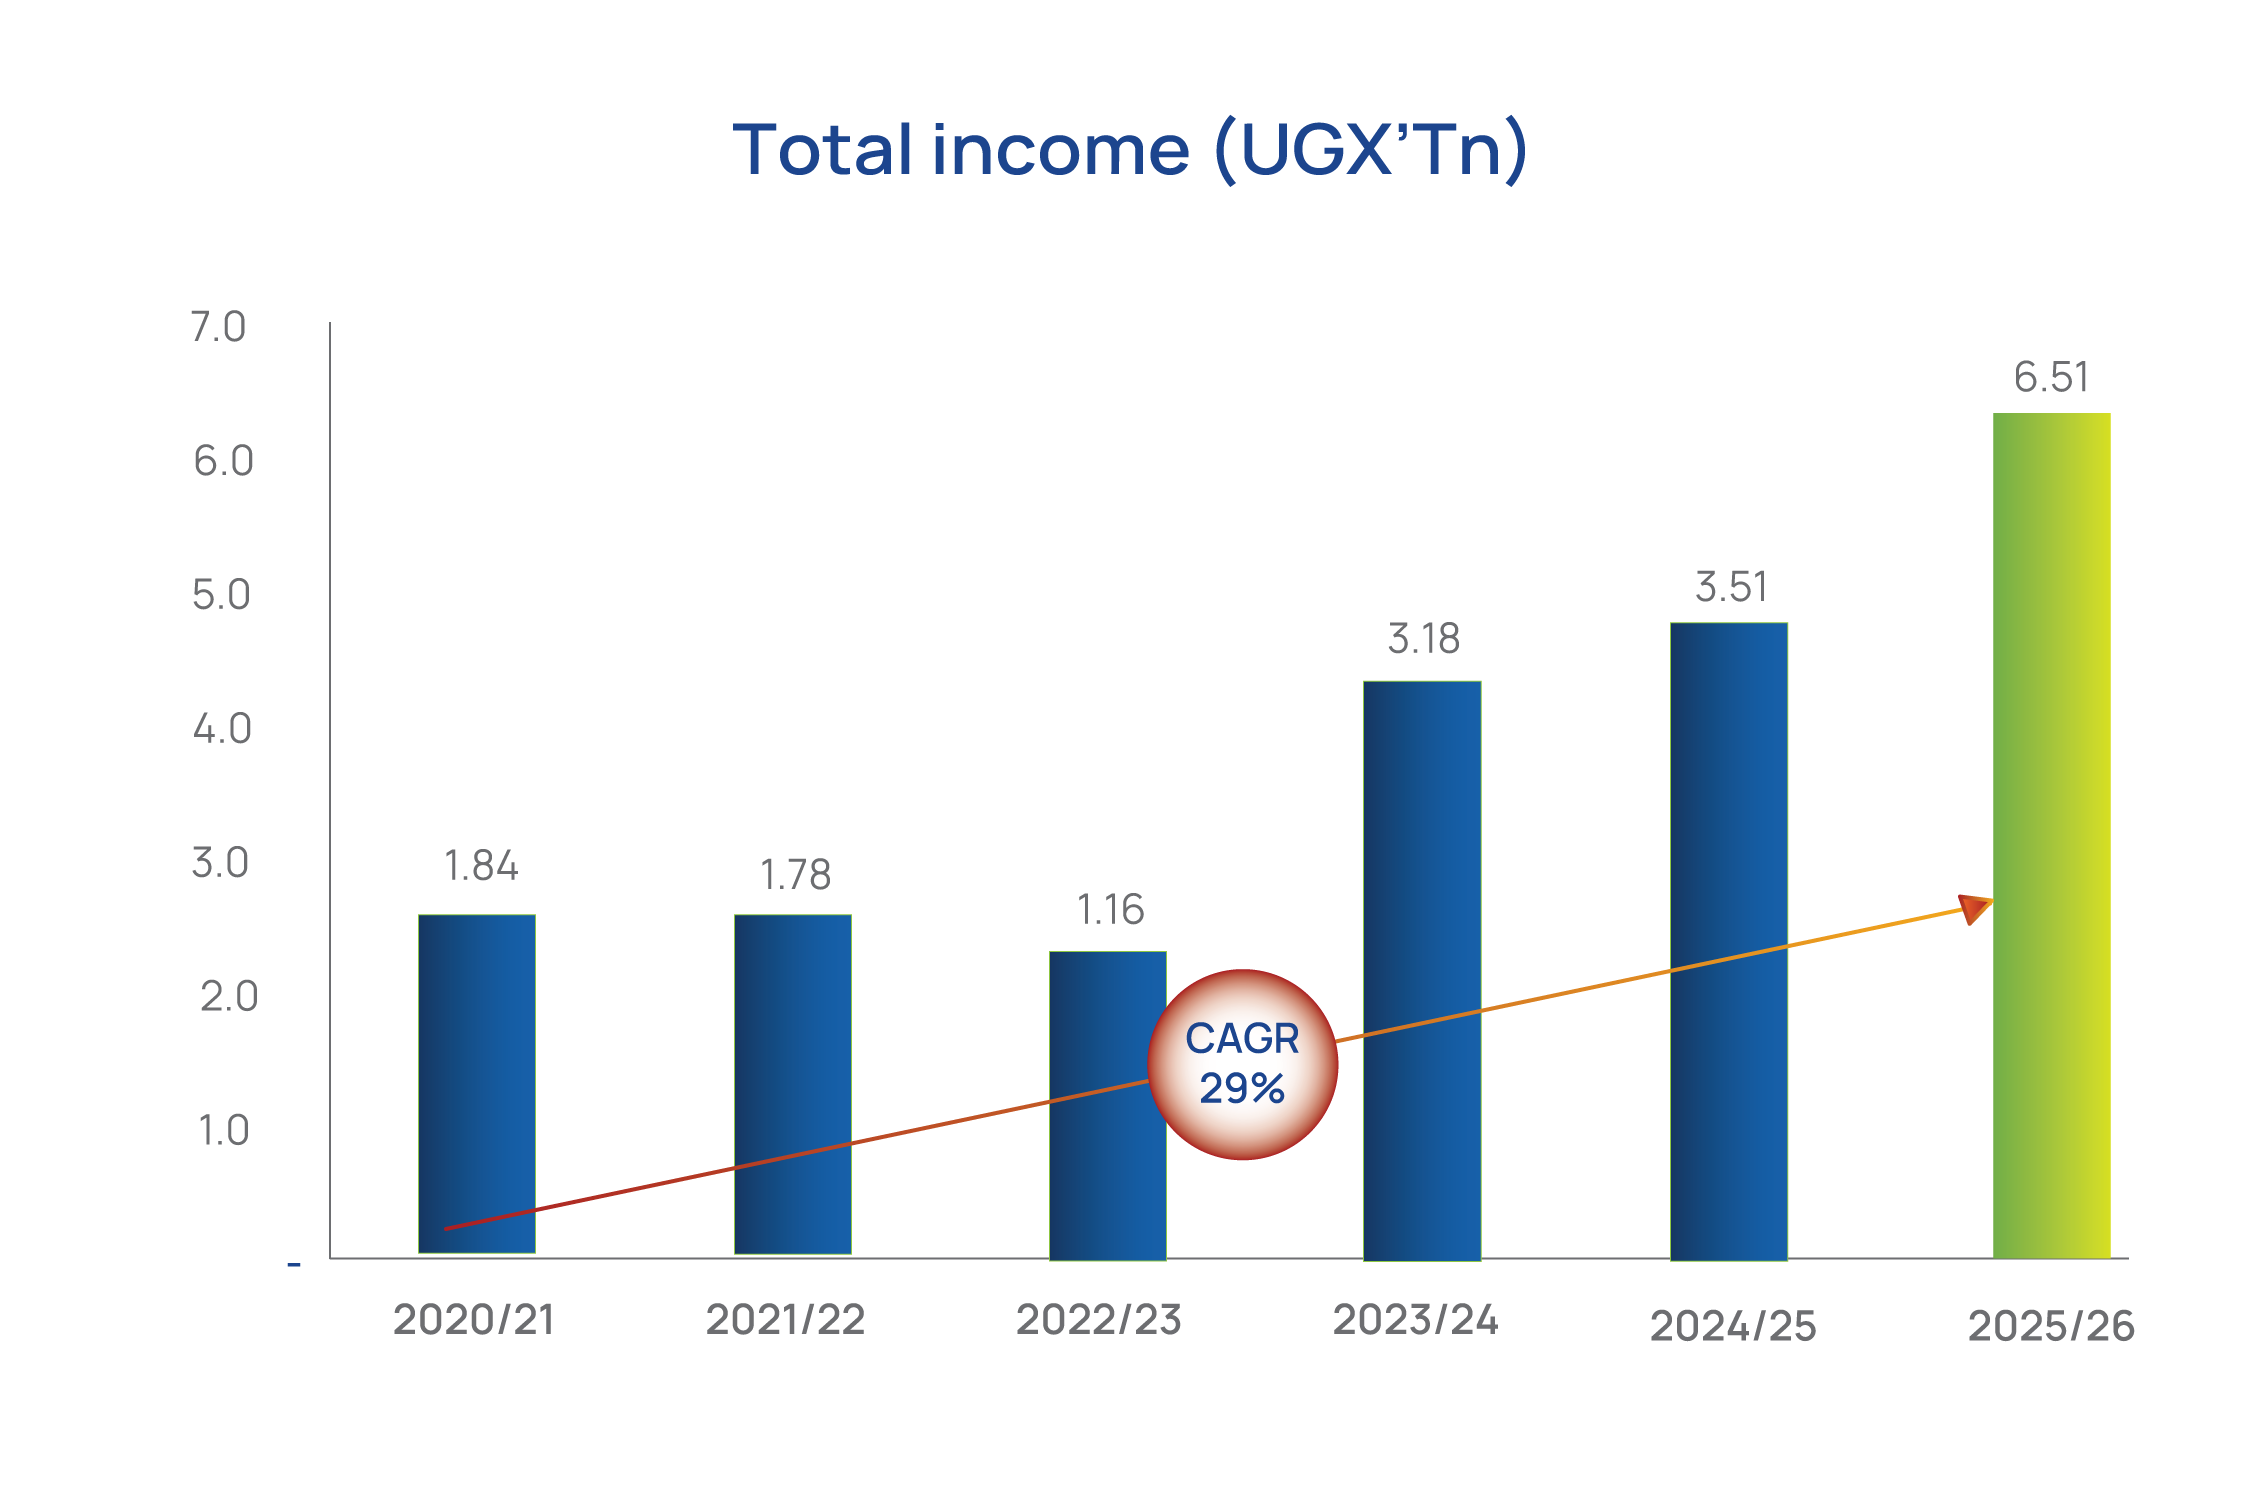
- Total income increased to UGX 6.51Tn (FY2024/25: UGX 3.51Tn; +85.1%), a five-year CAGR of +28.8%.
- Of this, realised income was UGX 3.88Tn (59.7% of total income; +23.9%) — interest income UGX 3.50Tn (53.8% of total; +21.5%), dividend income UGX 369.1Bn (5.7% of total; +55.0%), and real estate income UGX 16.0Bn (0.2% of total; -3.9%).
- The remaining UGX 2.62Tn (40.3% of total) was unrealised fair value gains on investments and foreign exchange, the primary driver of the headline growth.
Accumulated member fund
UGX 31.85Tn24.7%
15.8%Five-year CAGR
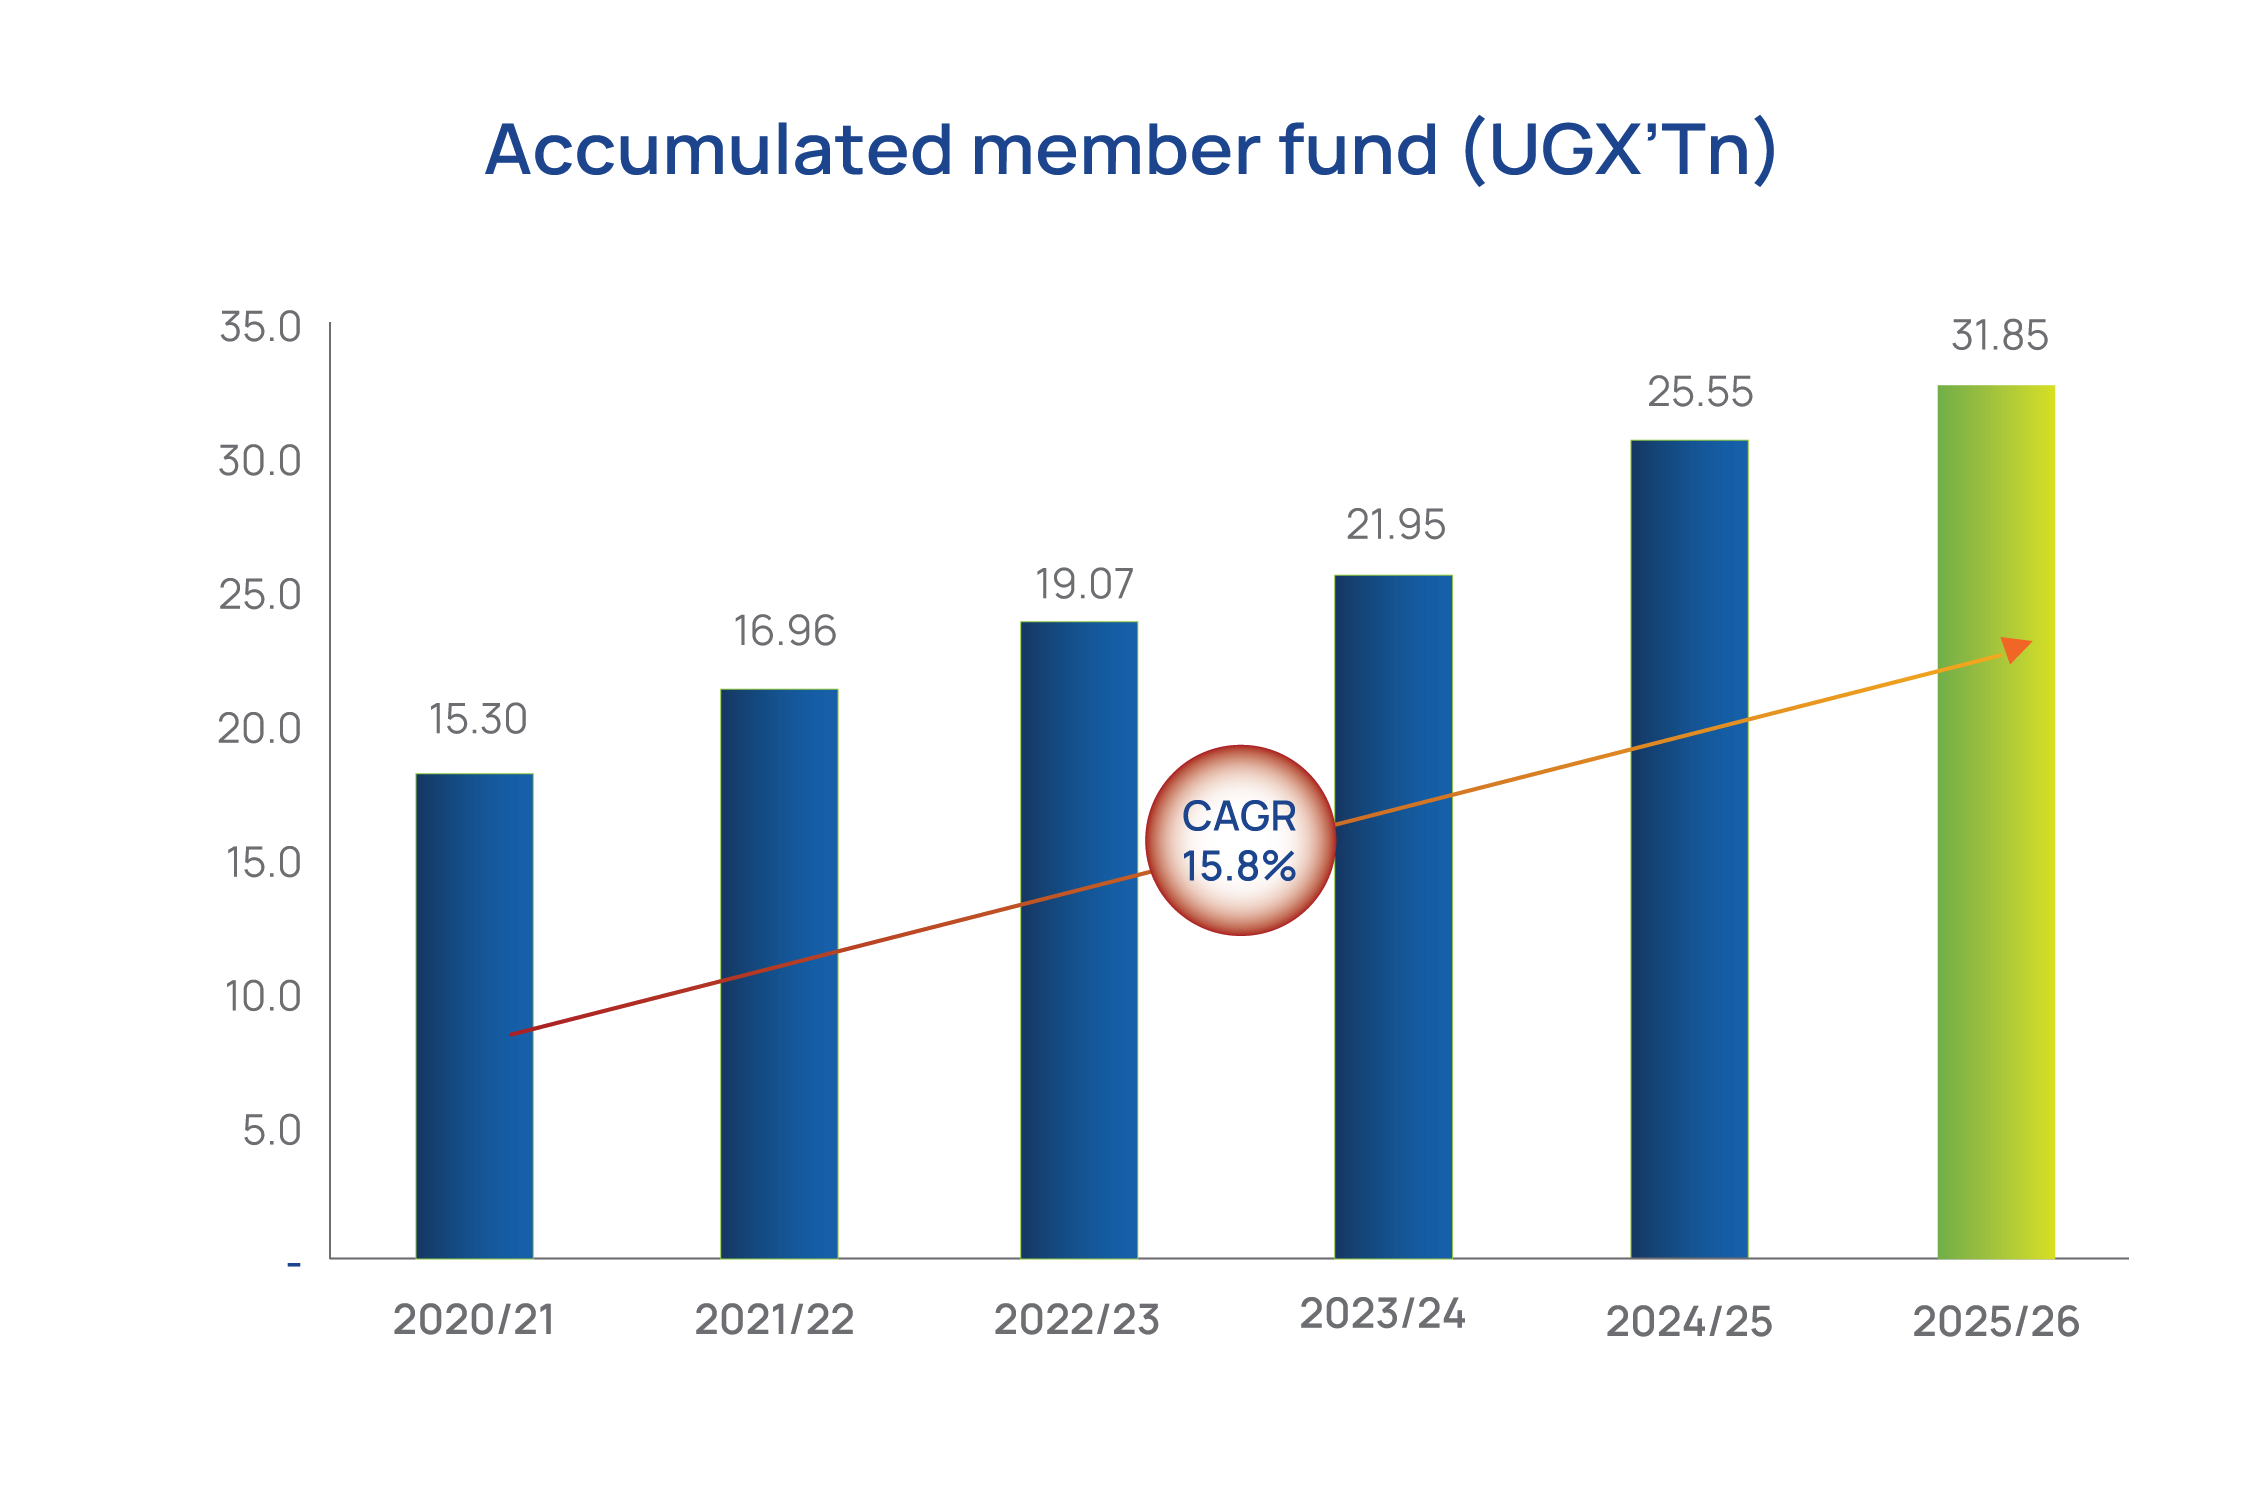
- Member fund increased to UGX 31.85Tn (FY2024/25: UGX 25.55Tn; +24.7%), a five-year CAGR of +15.8%, driven by contribution collections of UGX 2.42Tn (FY2024/25: UGX 2.13Tn; +13.6%; five-year CAGR +12.1%) and interest credited to members, net of total benefits paid of UGX 1.55Tn.
Growth in contributions collected
UGX 2.42Tn
13.6%Growth
12.1%Five-year CAGR
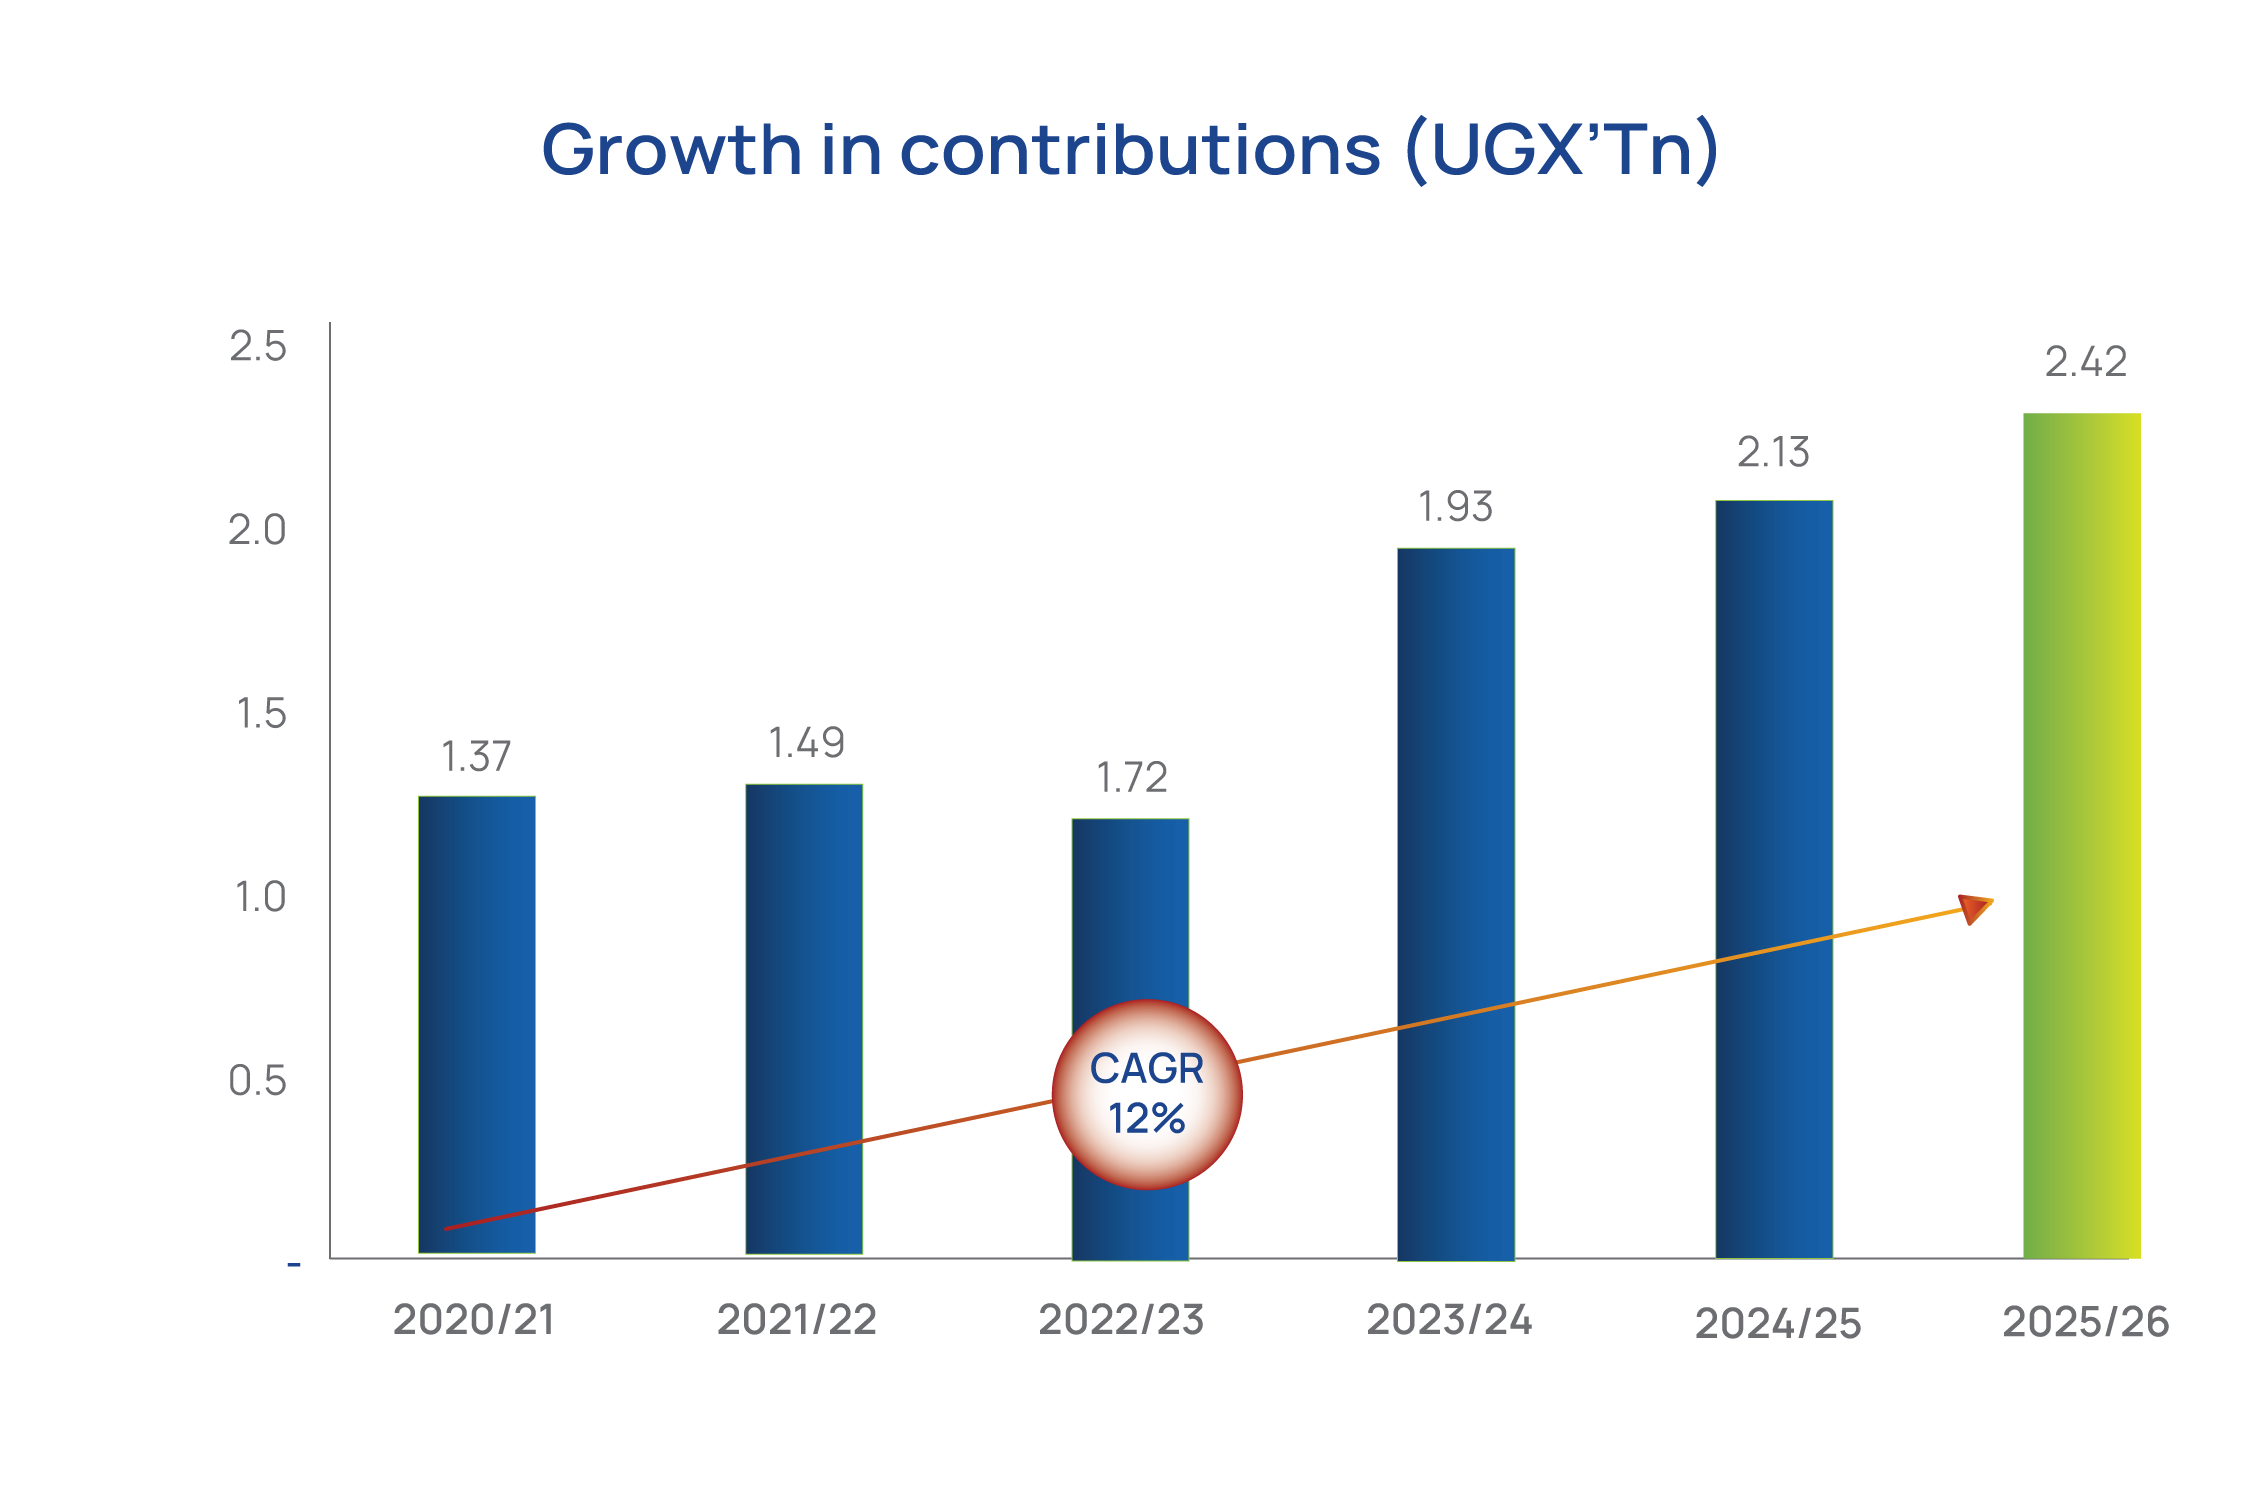
- Contribution collections increased to UGX 2.42Tn (FY2024/25: UGX 2.13Tn; +13.6%), a five-year CAGR of +12.1%, reflecting sustained growth in the registered employer and member base alongside improved compliance follow-up. Growth was further supported by voluntary contributions under the Smartlife Flexi product, launched in 2024.
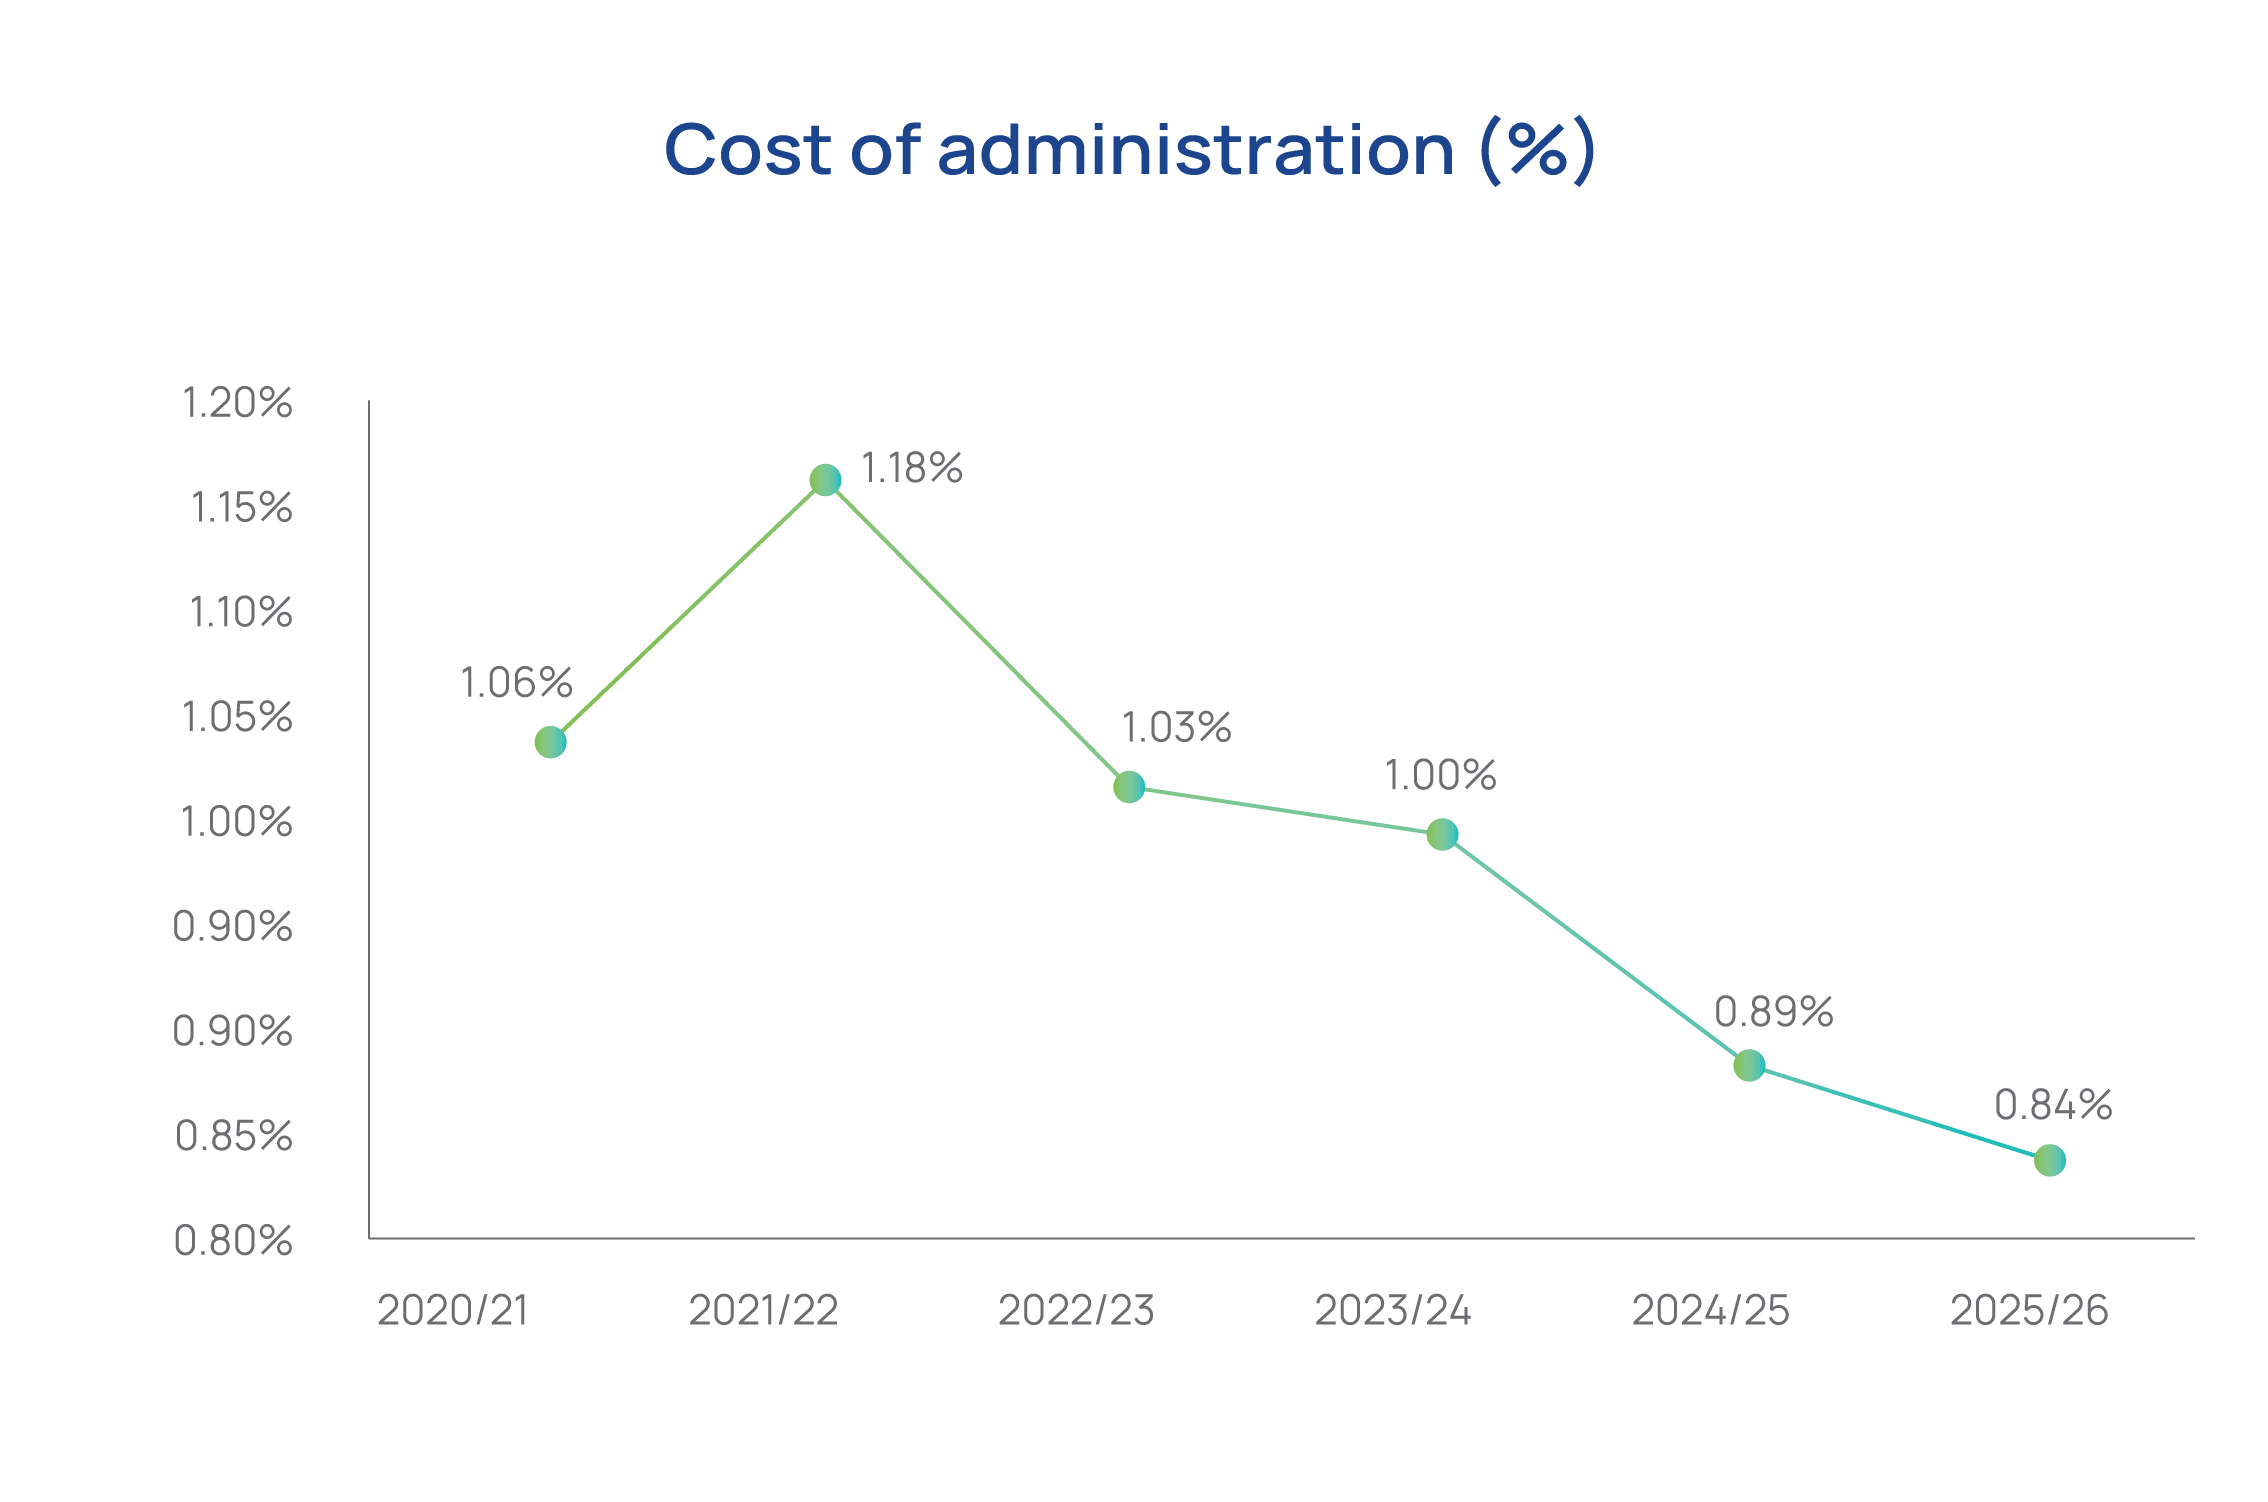
Cost of administration (%)
0.84%
- The expense ratio improved to 0.84% (FY2024/25: 0.89%; down 5.0bps), reflecting sustained progress in containing operating costs relative to a rapidly expanding balance sheet.
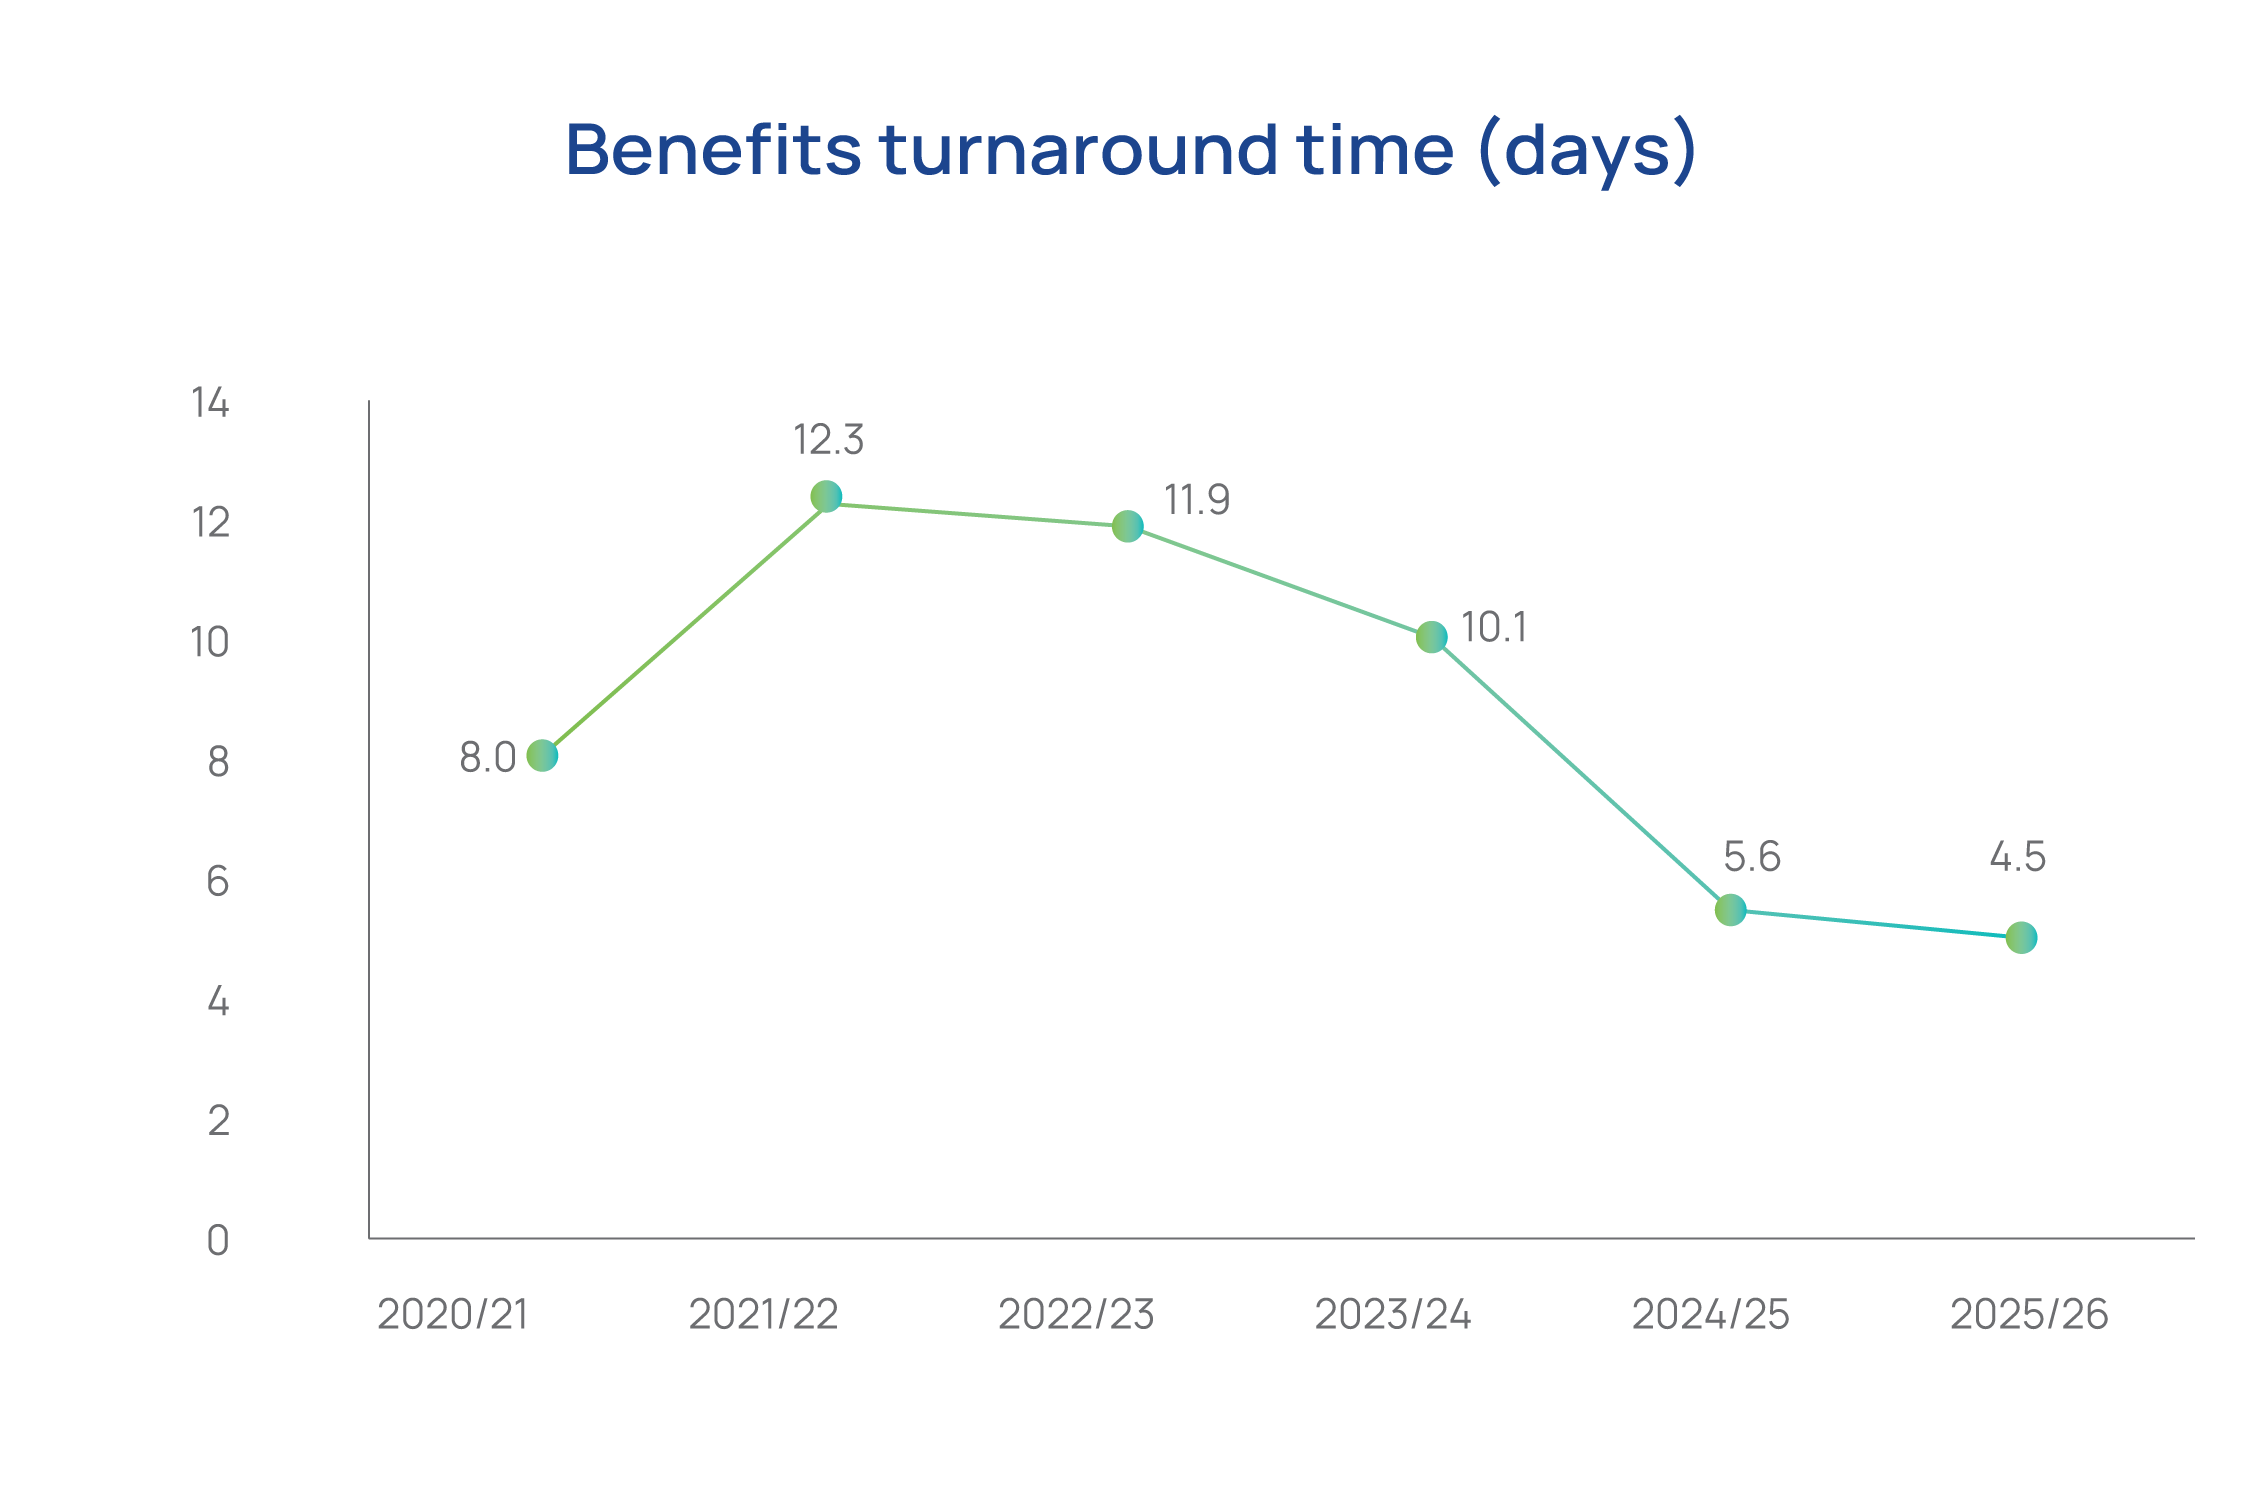
Benefits turnaround time (days)
4.5days
- Benefits turnaround time improved to 4.5 days (FY2024/25: 5.6 days; -20.5%), continuing the multi-year decline in processing time.
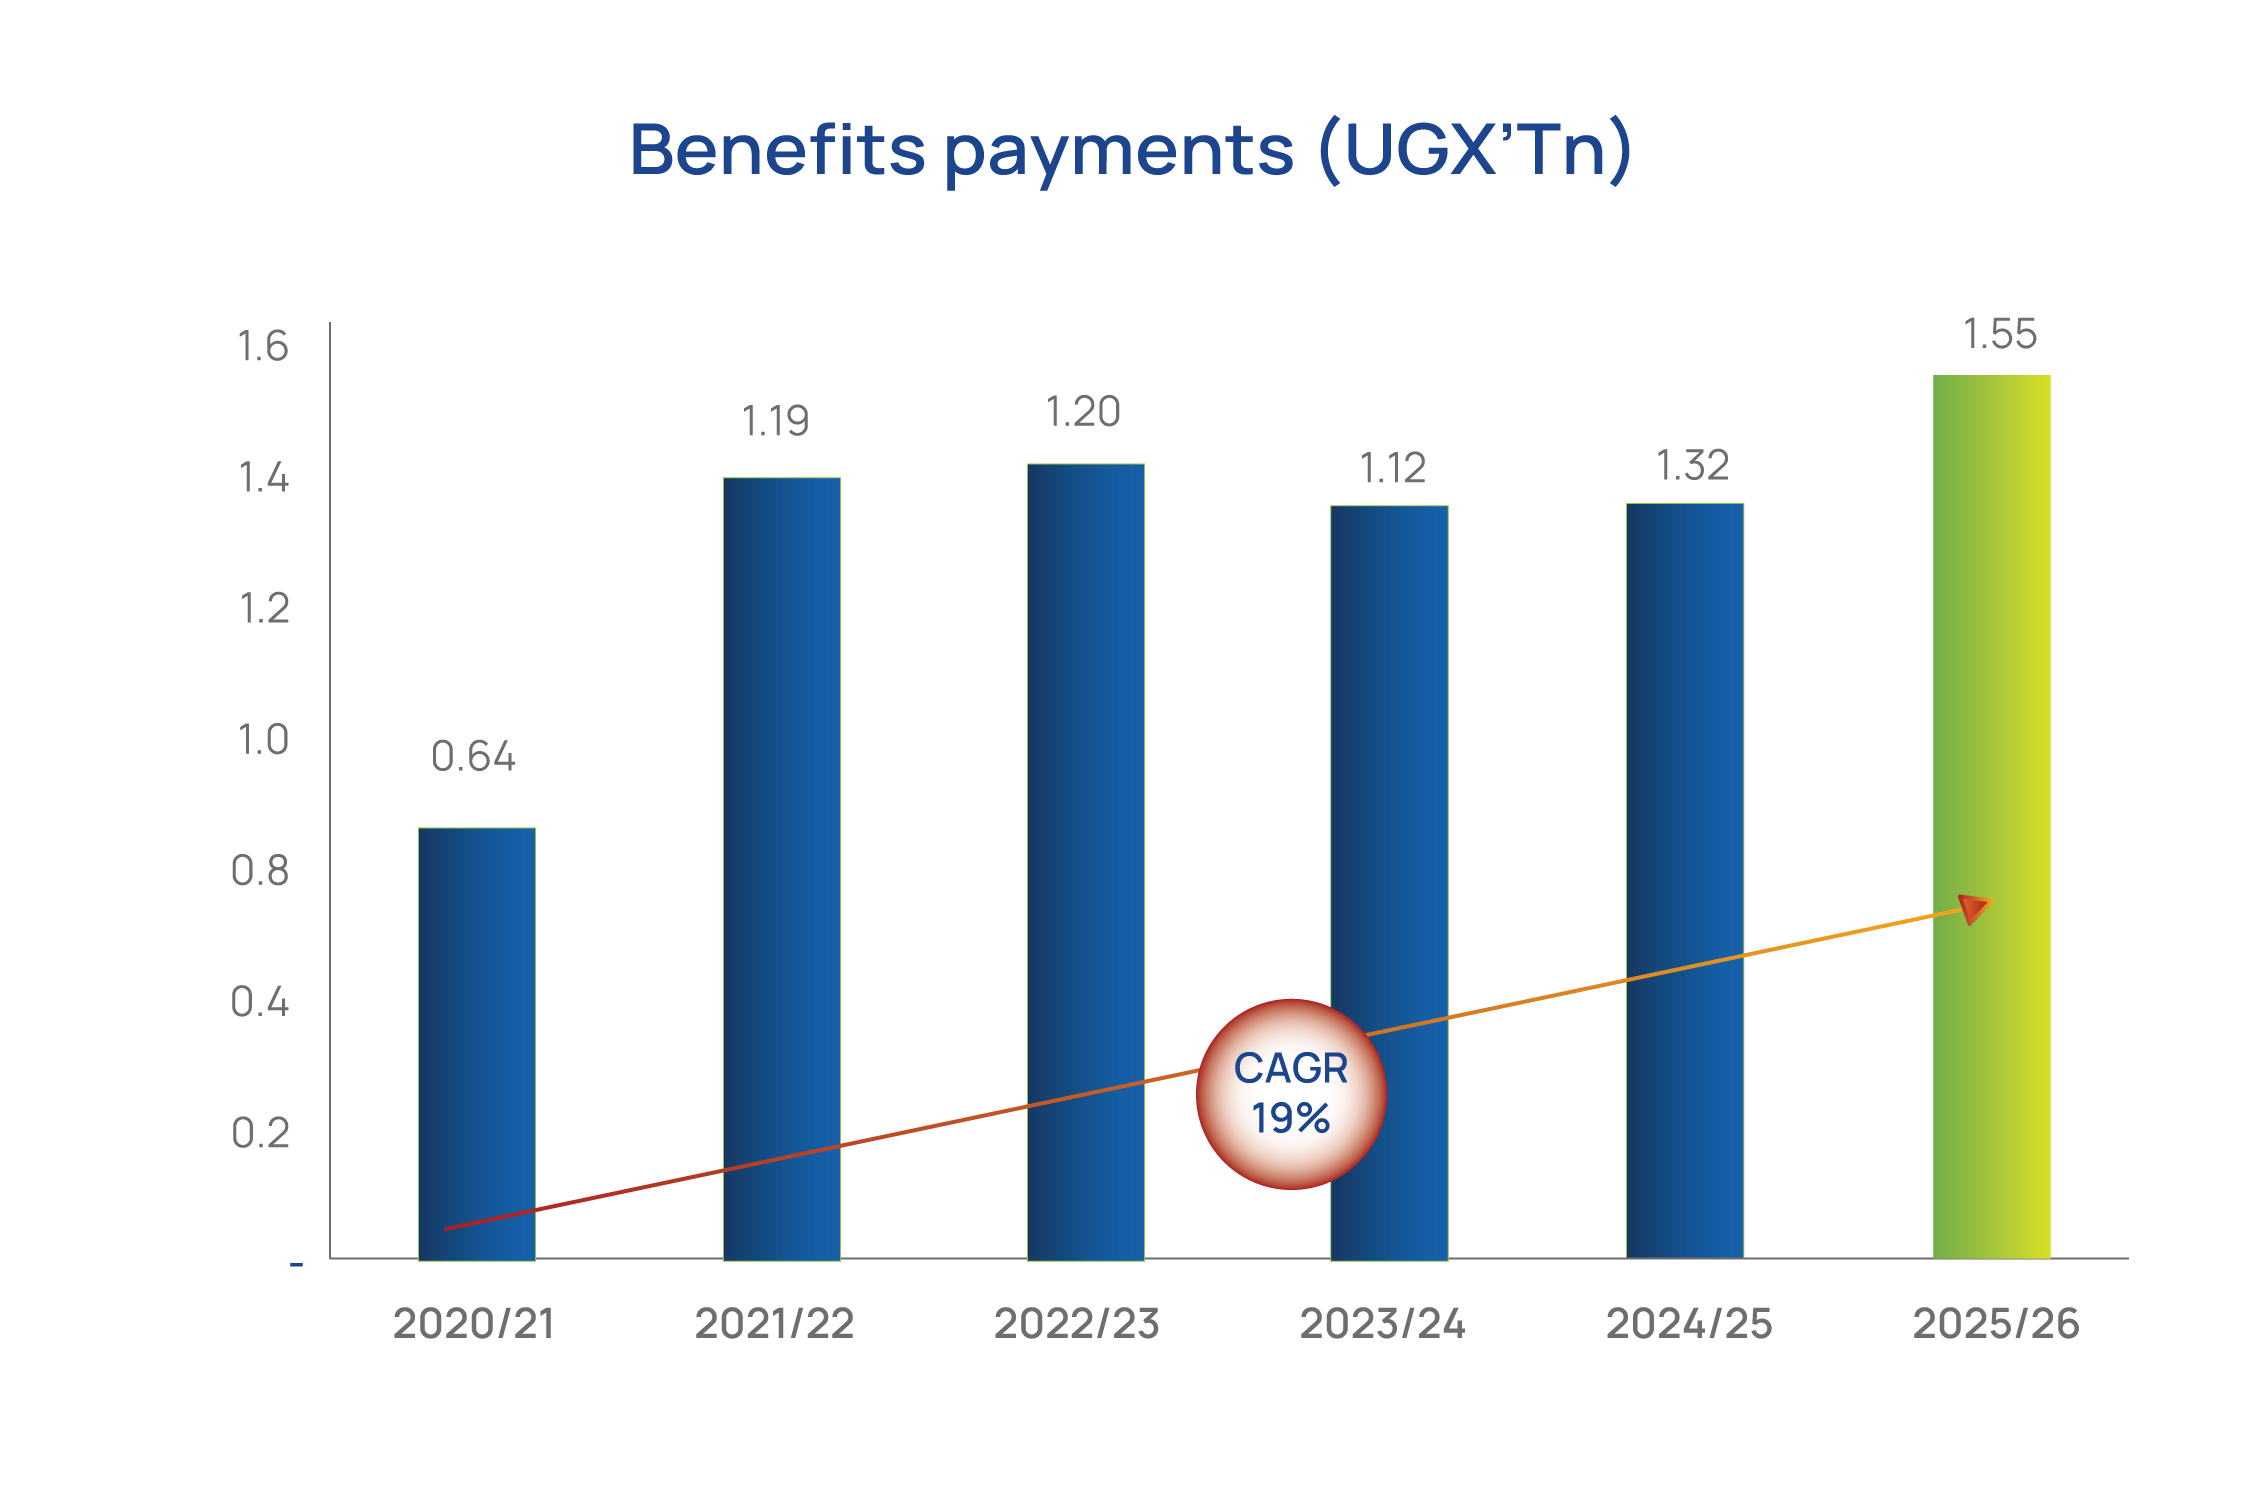
Benefits payments
UGX 1.55Tn17.4%
19.3%Five-year CAGR
- Benefits paid increased to UGX 1.55Tn (FY2024/25: UGX 1.32Tn; +17.4%), a five-year CAGR of +19.3%, continuing the growth trend in benefit withdrawals and the maturing member base.
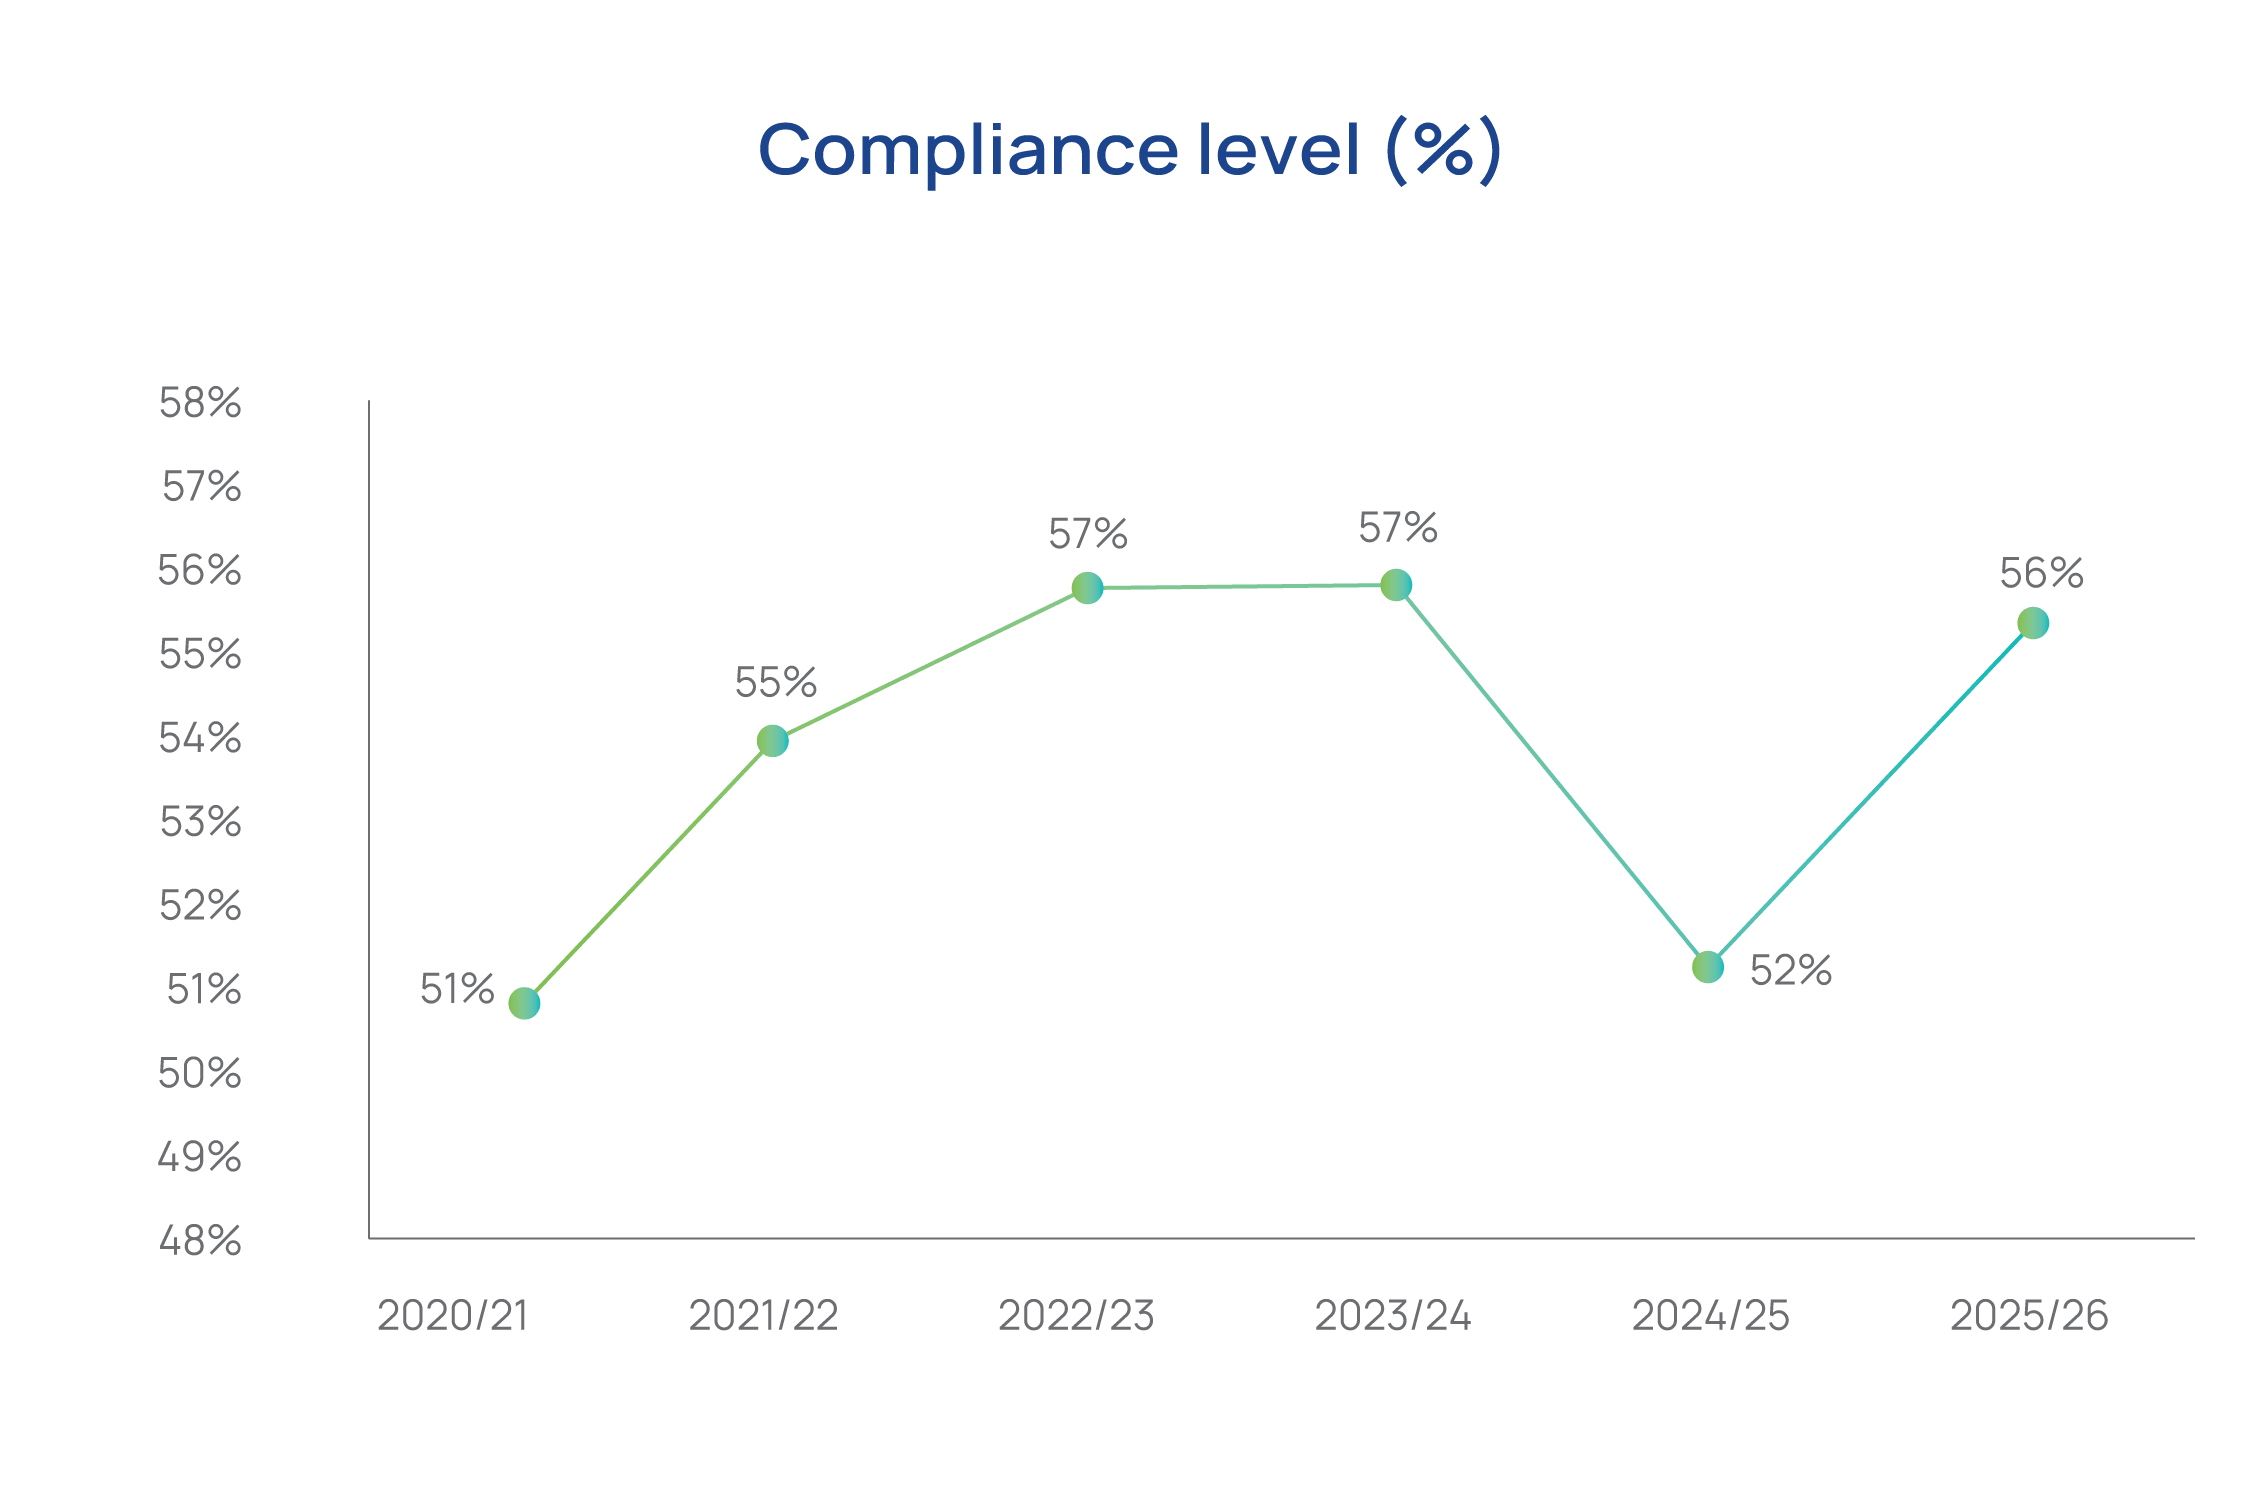
Compliance level (%)
56.0%
- Employer compliance improved to 56.0% (FY2024/25: 52.0%), reflecting stronger remittance follow-up among registered employers.