Portfolio performance and strategy
Energy
MSCI World IT
Tanzania (DSE ASI)
Five-year cumulative returns
The economic developments described above shaped the Fund's robust performance during the year, while the prevailing outlook informs its investment strategy and priorities going forward.
The drivers of performance differed by market.
In Uganda, the markets were buoyed by liquidity, particularly from foreign portfolio inflows as domestic yields remained elevated in the first half of the financial year. The relatively higher yields supported targeted fixed income reinvestments in the Uganda market.
In the region, a combination of factors drove a marked recovery across the East African equity markets. First, monetary easing stances increased domestic liquidity and decreased interest rates, moving flows from fixed income assets and increasing valuations. Second, steadier currencies and a soft US dollar attracted foreign flows into the markets. Third, the favourable macroeconomic environment supported robust corporate earnings and dividend declarations, attracting retail demand and underpinning strong valuations.
In Kenya, corporate catalysts added support, notably the sale of the government's Safaricom stake to Vodacom and the pending EABL–Asahi transaction.
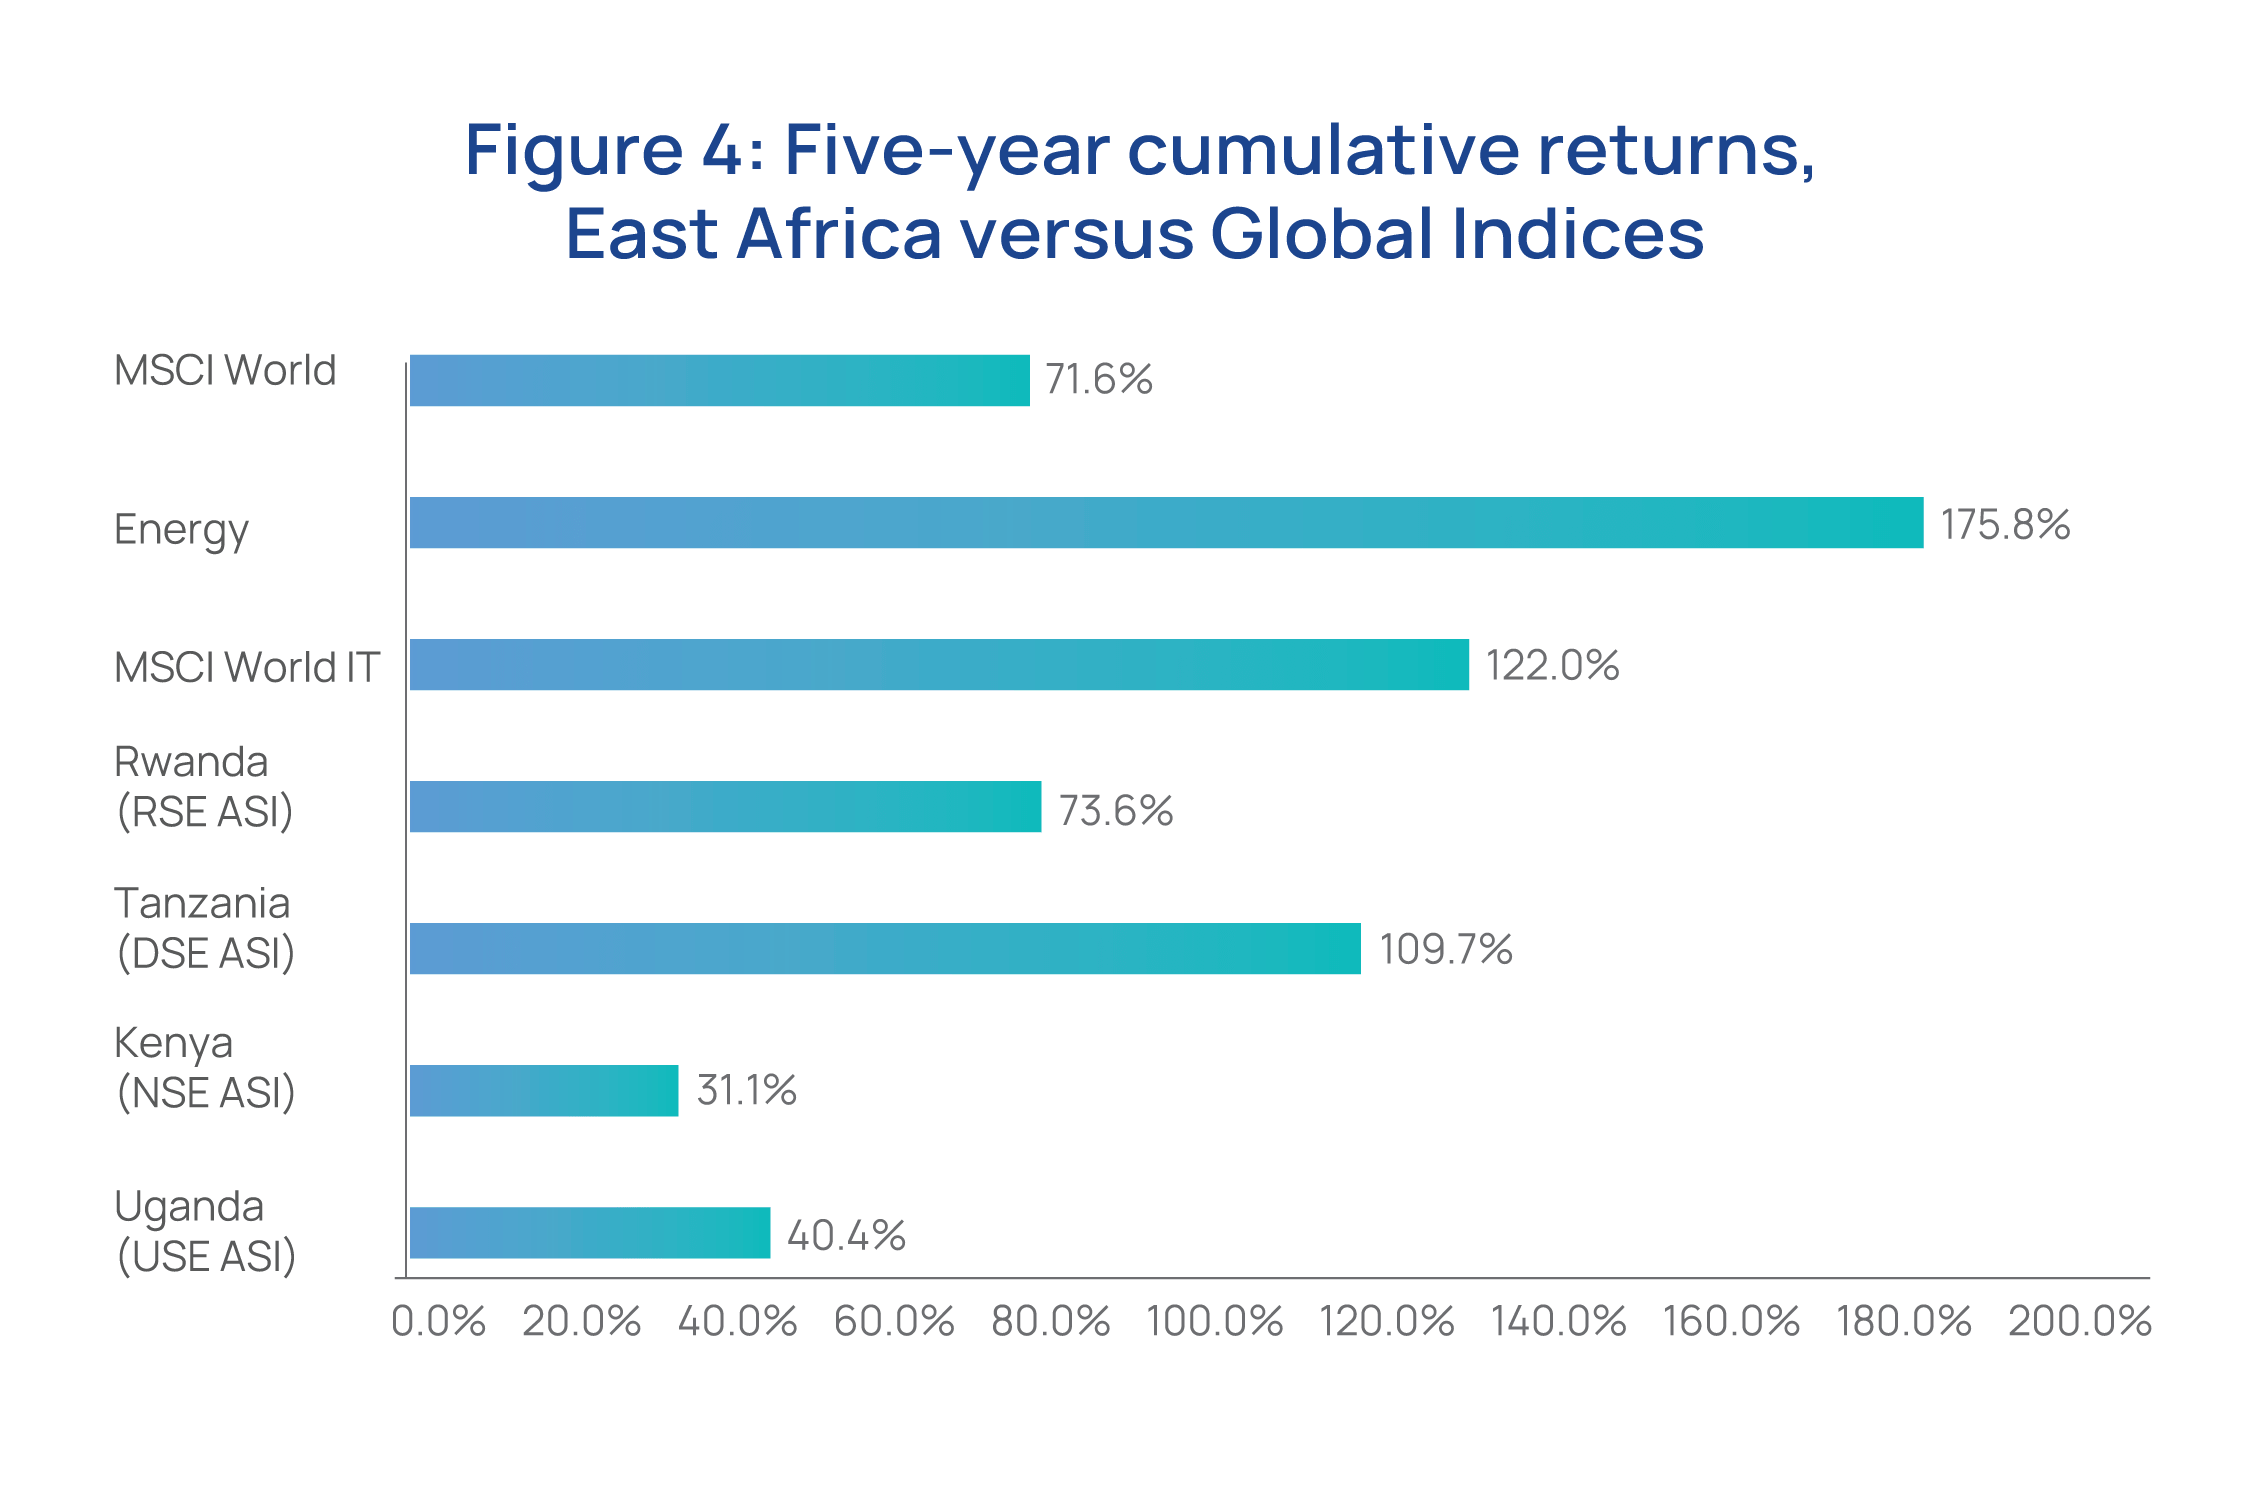
In Tanzania, leading banking counters reached record levels on the back of strong domestic and retail participation, enhanced by innovations in market access. This activity enhanced the five-year return of the Tanzania market, outstripping global benchmarks.
Fixed income
Equities
Real estate
These market conditions translated into strong gains across the portfolio. Assets under management grew by 26.4% over the fiscal year to close at UGX 32.87 trillion, from UGX 26.01 trillion a year earlier.
At the end of the year, 77.0% of the portfolio was held in fixed income, 18.0% in equities and 5.0% in real estate. The allocation to equities rose sharply from 13.2% a year earlier, because of the valuation gains across regional bourses and a few select purchases in the Kenyan market. The fixed income and real estate weights eased correspondingly, each remaining comfortably within the Fund's strategic asset allocation limits.
By market, exposure to Uganda increased to 68.4% from 66.5%, reflecting the reallocation of fixed income towards the higher-yielding Ugandan market and the shilling's appreciation against regional currencies. Exposure to Kenya declined to 21.6%, Tanzania stood at 9.7%, and Rwanda accounted for the residual at 0.2%.